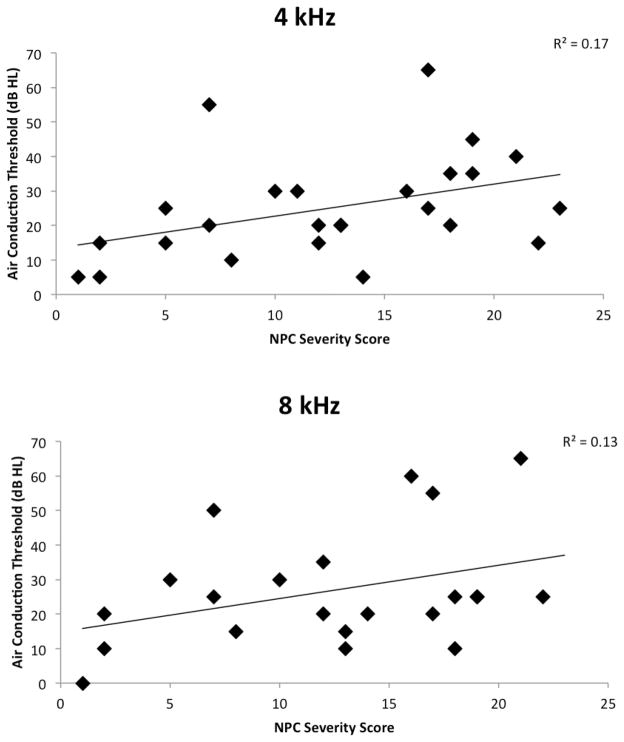
Figure 3.
Air-conduction thresholds of the poorer-hearing ear plotted against total disease severity score (Yanjanin et al., 2009) at 4 kHz (top panel) and 8 kHz (bottom panel) for 25 and 22 patients, respectively, for whom these data were available.

