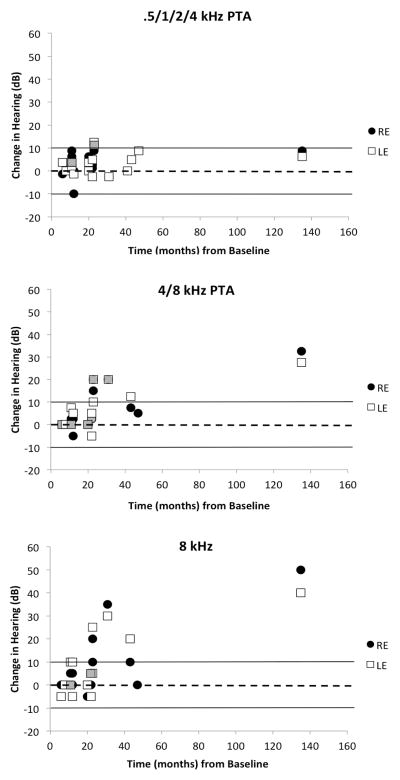
Figure 4.
Individual change in air-conduction thresholds from baseline to the final audiologic assessment, as a function of duration of follow-up (months) for a four-frequency (top panel) and high-frequency pure-tone average (PTA) (middle panel), and 8 kHz (bottom panel). Dashed line at 0 dB indicates no change in threshold; positive values depict a decline in threshold and negative values depict an improvement in threshold. Solid lines demarcate the range of test/retest variability standardly associated with pure-tone threshold assessment. Grayed symbols indicate overlapping data points.

