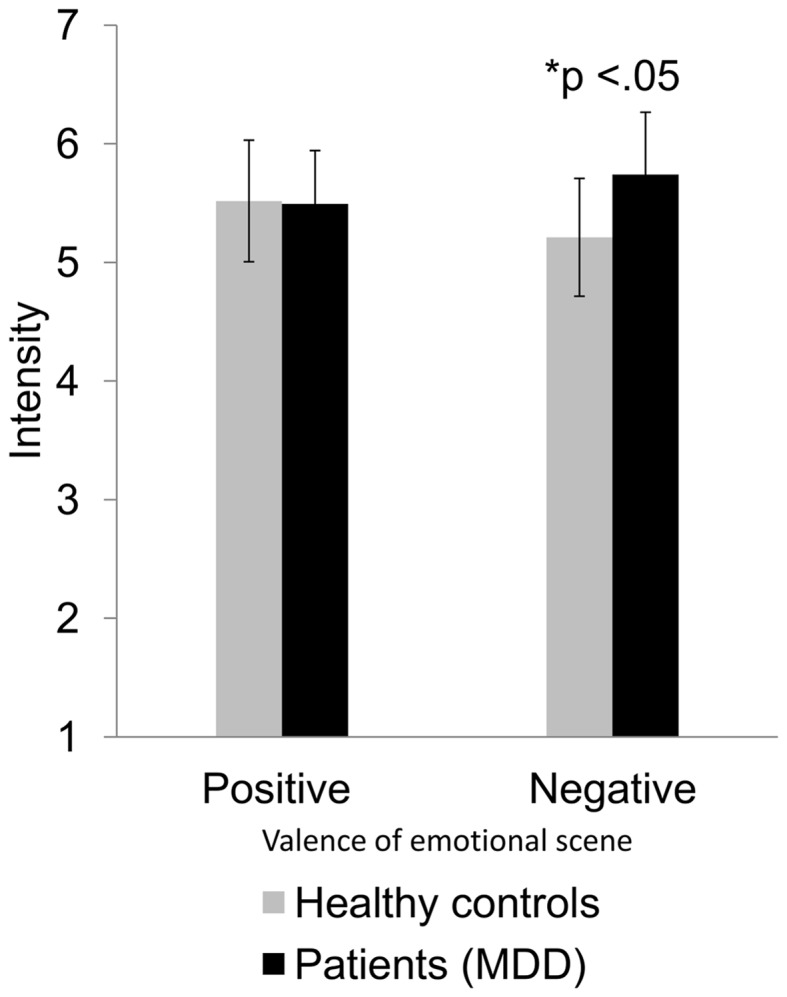
Figure 3.

Differences in rating intensity of patients with MDD and healthy controls for positive and negative emotional interactions. Average intensity ratings and their standard deviations are displayed as a function of participant group (healthy controls vs. patients with MDD) and valence of depicted emotional scene (positive vs. negative). The difference is significant at the 0.05 level.
