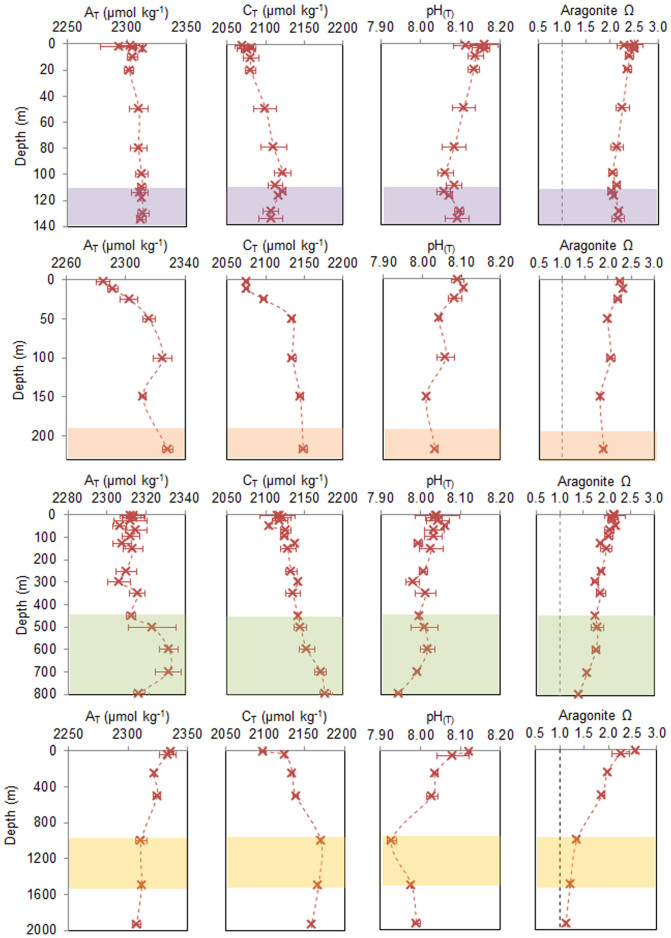
Figure 4. Average (mean ± standard deviation) profiles through the water column at all sites: (first row) Mingulay Reef Complex, (second row) Pisces, (third row) Logachev, and (fourth row) Hebrides Terrace Seamount, for (first column) total alkalinity (AT), (second column) dissolved inorganic carbon (CT), (third column) pH (total scale), and (fourth column) aragonite saturation state (Ωaragonite).
Also showing the depth ranges where CWC reefs were observed during ROV dives (colored areas on each graph). Note the depth scale changes.

