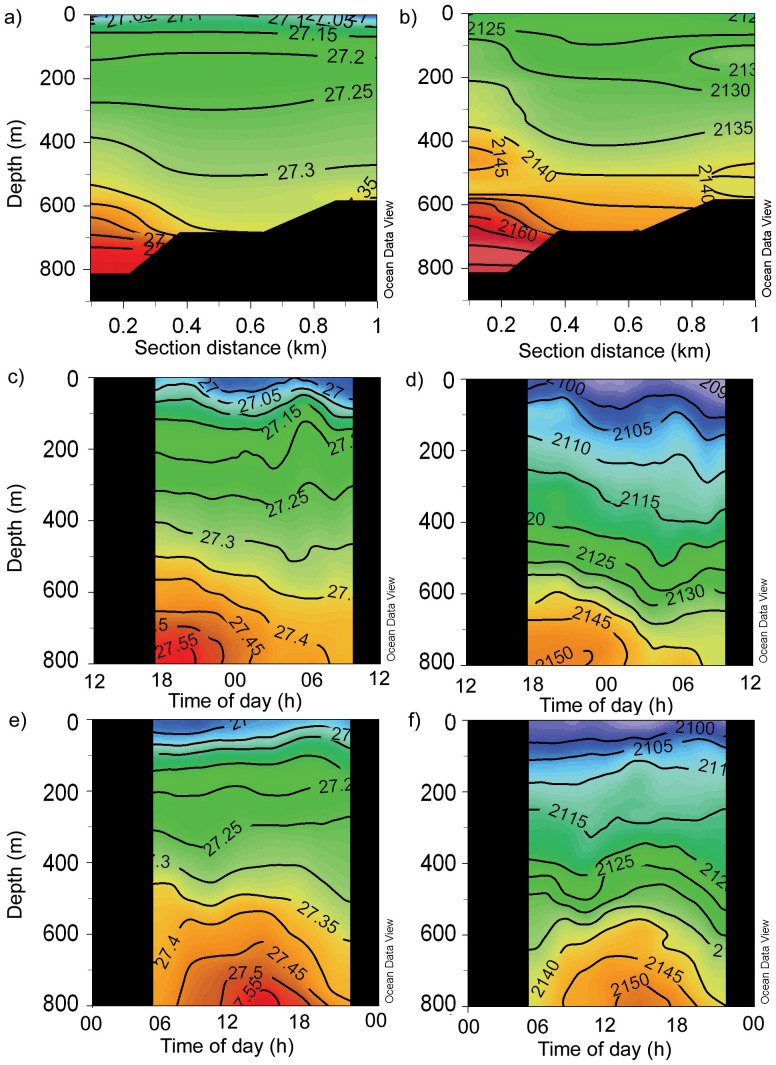
Figure 6. Profiles of density (a, c, e) and nCT (μmol kg−1) estimated from Oxygen % saturation (see text, equation 1) (b, d, f) across a transect ‘Section 1’ up onto the Rockall Bank (a and c), and through time, over one 24 hour period, for stations at Logachev North ‘LN’ (c and d) and Logachev South ‘LS’ (e and f).
See figure 1 for location of the transect and the two stations LS and LN.

