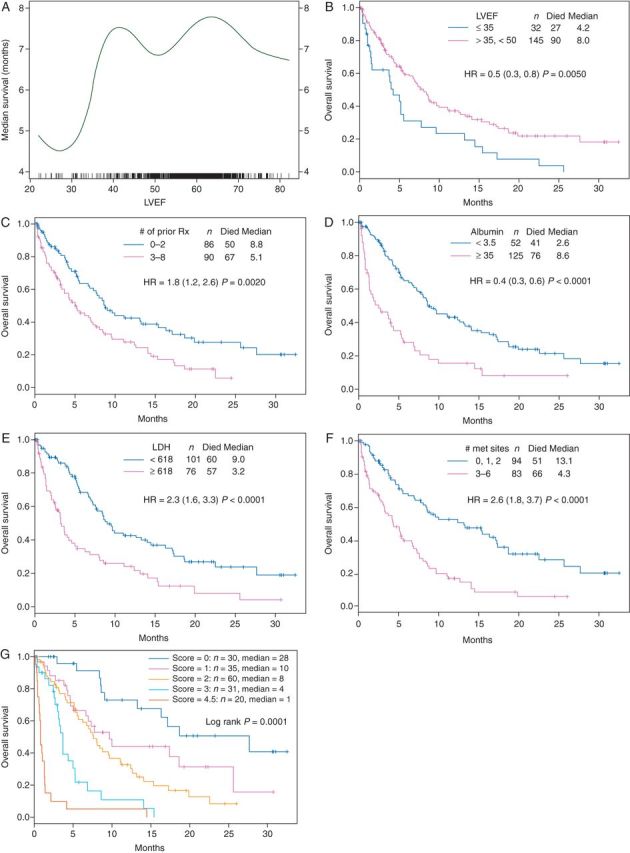
Figure 1.

(A) The median OS curve by LVEF. (B) The Kaplan Meier OS curve by LVEF. (C) The Kaplan–Meier curve of OS by the number of prior treatments. (D) The Kaplan–Meier curve of OS by the albumin level. (E) The Kaplan–Meier curve of OS by the LDH level. (F) The Kaplan–Meier curve of OS by the number of metastatic sites. (G) The Kaplan–Meier curve of OS by the different risk scores.
