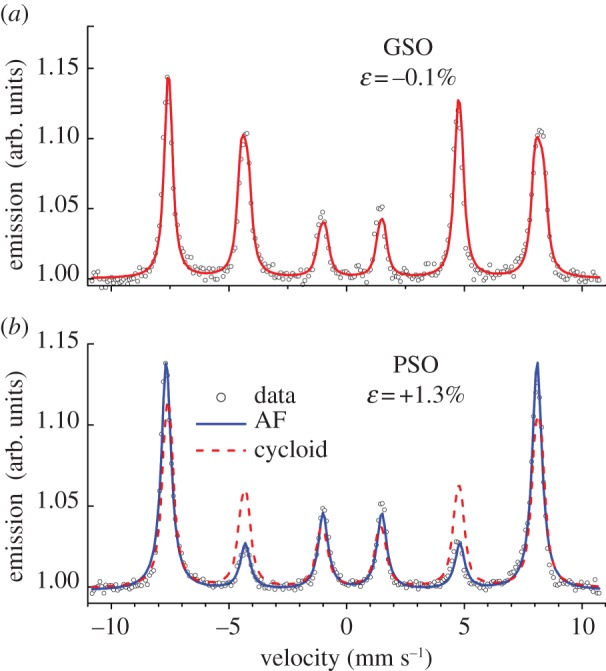
Figure 3.

Conversion electron Mössbauer spectra at 295 K for two BFO films; (a) one on GSO and (b) the other on PSO. The symbols correspond to the data, the red lines to a fit with a cycloidal model and the blue line to a fit with an antiferromagnetic (AF) order. Adapted from [39]. (Online version in colour.)
