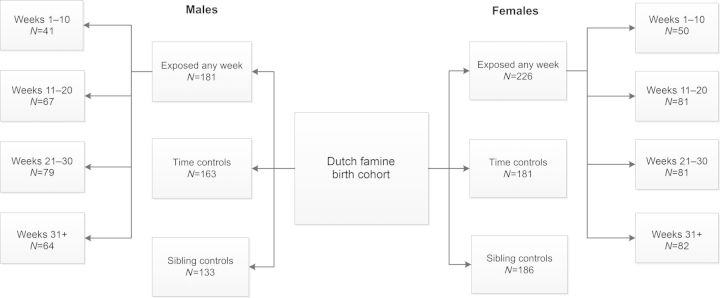
Figure 1.

Flow chart of the study population. Exposed any week: all births between 1 February 1945 and 31 March 1946 and divided in gestational weeks of exposure to an official ration of <900 kcal/day. Time controls: births from 1943 to 1947. Sibling controls: same sex siblings unexposed to famine.
