Figure 3.
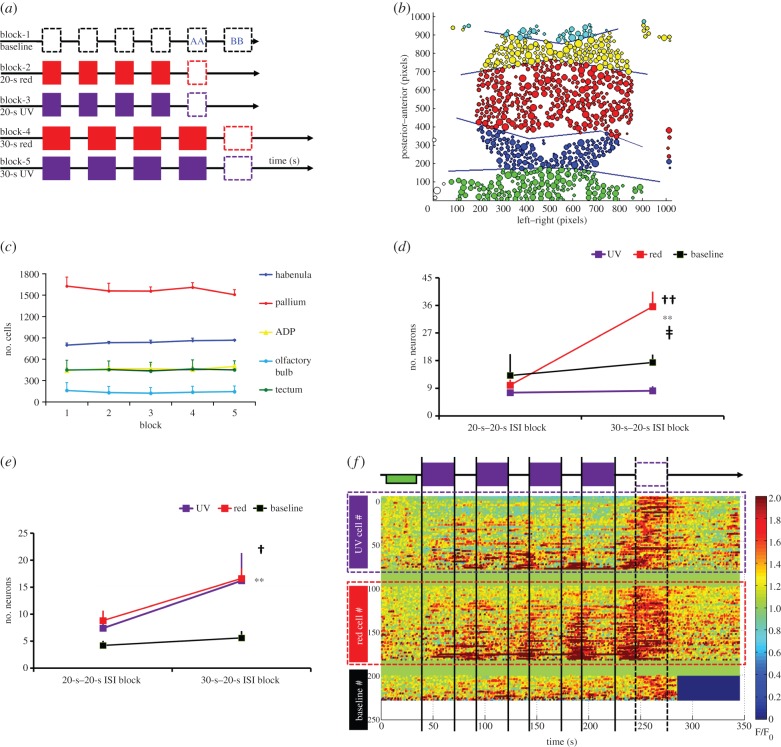
(a) Schematic diagram and time line of the experiment design. The stimulus is turned on four times for 20 s in Blocks 2 and 3 and 30 s in Blocks 4 and 5, all with a fixed ISI at 20 s. Block 1 is baseline recording, during which no stimuli were presented. The missing fifth stimulus (the empty dashed rectangular box) is the time window in which we identify the OSR neurons throughout the brain. In Block 1, the first empty dashed rectangular box (labelled AA) was used as the time window to obtain the baseline number of neurons meeting the OSR criteria for comparison with Blocks 2 and 3. The second empty dashed rectangular box in Block 1 (labelled BB) was used as the baseline window to obtain the OSR for comparison with Blocks 4 and 5. (b) Schematic diagram of cell segmentation of the whole brain using ImageJ automated algorithm (see the electronic supplementary materials for details). The brain is dissected into five different regions—blue for the habenula, red for the pallium, yellow for the anterior-dorsolateral pallium, light blue for the olfactory bulb and green for the tectum. The entire brain was scanned at five different z-planes with a distance of 12 µm between planes. With a range of 48 µm from top to ventral, the imaging covers the entire habenula and most of the pallium (1 pixel = 0.215 µm). (c) Mean (±s.e.m.) number of segmented neurons as a function of five recording blocks in each of the five subregions. There was no significant difference (p = 0.91) in the factor block and no significant interaction (p = 0.31) between block and brain regions across the five blocks indicating that the number of identified neurons remain at the same level across blocks. (d) Mean (±s.e.m.) pallium OSR neurons for colour and block conditions. The symbol †† indicates a significant difference for the factor of colour (p < 0.01) while the symbol ** indicates a significant difference for the factor of block (p < 0.01). The symbol ‡ indicates a significant interaction between colour and block (p < 0.05). (e) Mean (±s.e.m.) habenula OSR neurons for colour and block conditions. The symbol † indicates a significant difference for the factor of colour (p < 0.05), while the symbol ** indicates a significant difference for the factor of block (p < 0.01). (f) Ratio heatmap (F/F0) of habenula OSR neurons from all five fish in the 30-s UV, red and baseline conditions. The green rectangle bar in the beginning of the block indicates the time window (6–40 s) where the mean baseline fluorescence level (F0) was taken. The list of neurons from top to bottom is sorted by ascending standard deviation (s.d. from min to max) during the stimulus sequence, thus neurons with lesser response during the stimulus sequence appear at the top of each colour condition. There were 81 habenula OSR neurons (Rows 1–81) in the UV condition and 83 habenula OSR neurons (Rows 101–183) in the red condition. In the baseline, only 27 habenula neurons (Rows 201–227) met the OSR criteria owing to spontaneous activity in the habenula.

