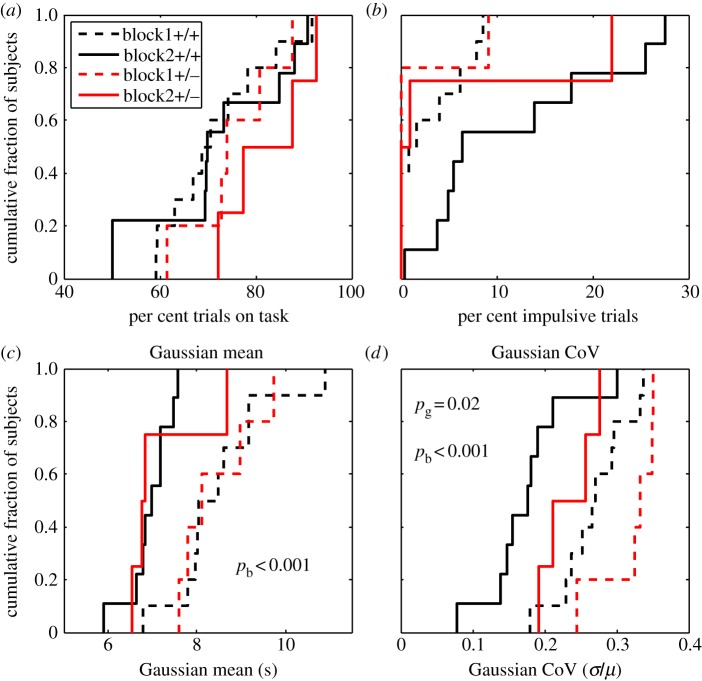
Figure 10.
(a–d) Cumulative distributions of per cent trials on task, per cent impulsive trials, Gaussian mean switch latency and precision (CoV) in the Batface line, as a function of trial block and genotype. Difference in colour denotes difference in trial block (hence, in the nominal feed latency at the long hopper), while solid versus dashed denotes difference in genotype. The p-values (pg for genotype and pb for block) are for the main effects in two-way ANOVAs. The only main effect of genotype was on the precision with which switches were timed (bottom right plot): the heterozygotes were less precise. (Online version in colour.)

