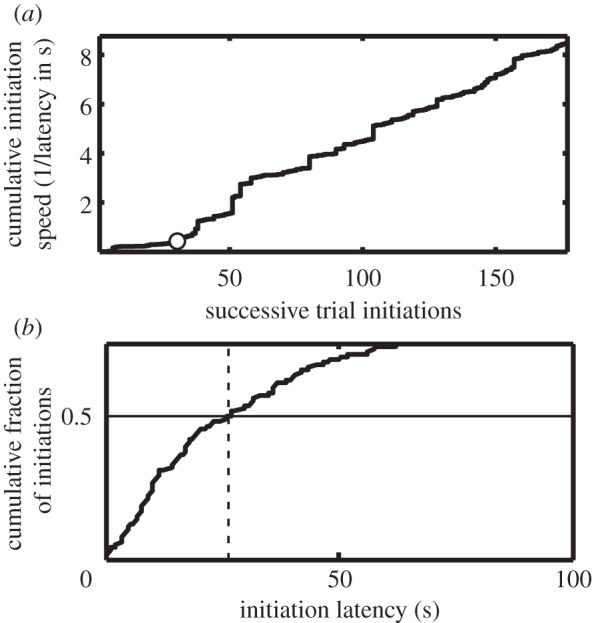
Figure 3.

(a) Illustrative cumulative record of trial-initiation speed (speed = 1/latency in seconds). The open circle marks the trial at which the slope of the cumulative record increased, which we take to be the trial of acquisition for the instrumental response. (b) Illustrative cumulative distribution of trial-initiation latencies. The median latency (vertical dashed line) is the latency at which the horizontal solid line at 0.5 intersects the cumulative distribution. The distribution is truncated at 0.7, because the extremely long latencies at the tail of the distribution prevent the much shorter bulk of the distribution to be clearly seen.
