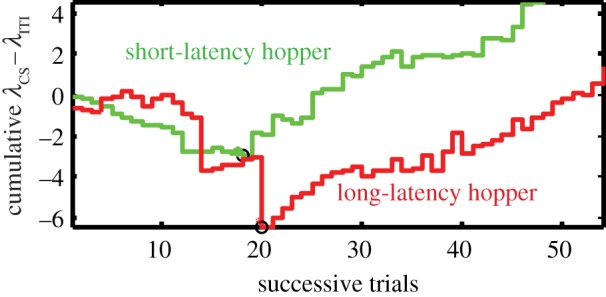
Figure 4.

Illustrative cumulative records of the trial-by-trial difference between the rate of poking during the illumination of a flanking hopper (λCS) and the rate of poking into that same hopper during the intertrial interval (λITI), when it is not illuminated and not about to deliver a pellet. Heavy dots mark the trials where the slopes reverse from negative to positive. The point at which this reversal occurs is our measure of trials-to-acquisition for the classically conditioned responses. (Online version in colour.)
