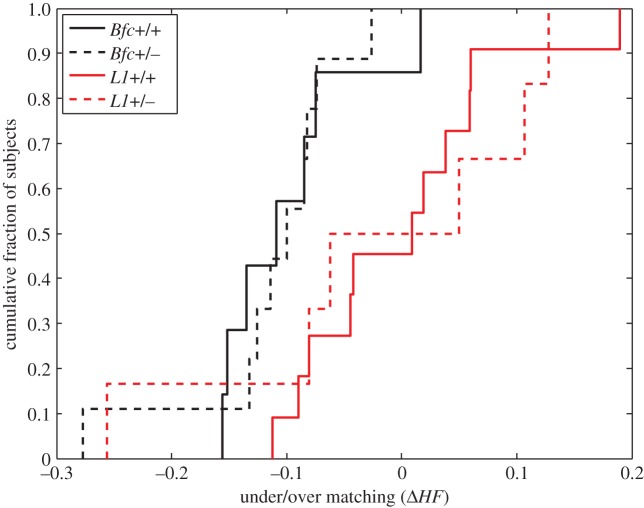
Figure 7.
Cumulative distributions of matching errors for wild-type and heterozygotic Bfc mice and for wild-type and heterozygotic L1 mice.  signed as follows: if the proportion invested is more extreme than the income proportion, the sign is positive (overmatching); if the proportion invested is less extreme than the income proportion, the sign is negative (undermatching). There is no effect of genotype in either line, but the lines do appear to differ in their bias (toward undermatching, which is common), and in the magnitude of their errors. (Online version in colour.)

