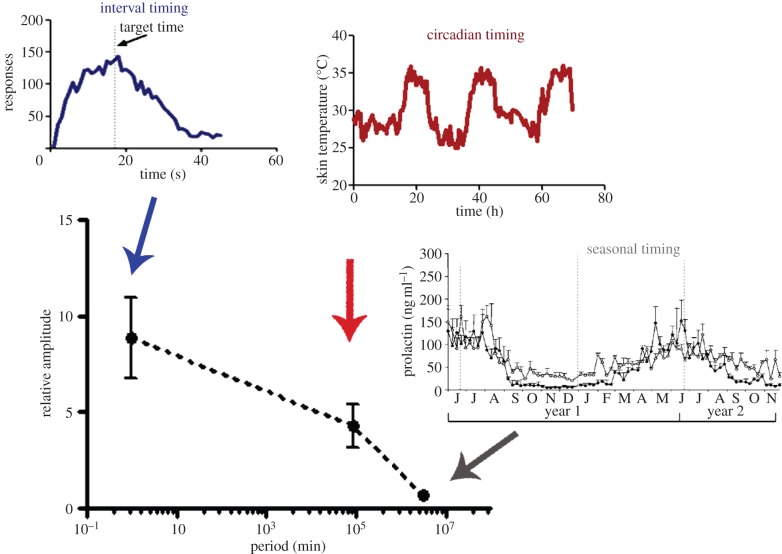
Figure 1.
Relative amplitude of biological timing. Spectrum of biological timing phenomena, from interval timing to seasonal rhythms. The main graph shows the period of such timing mechanisms, spanning about seven orders of magnitude. When relative amplitude (calculated from representative data from the available literature by dividing the average amplitude values—considered as the difference between trough and peak values—by the minimal level of the variables) is compared, a negative correlation between period and amplitude of the oscillations/behavioural responses is found. Mean ± s.d. is shown, n = 5–8. Insets—described clockwise from the top—show representative data from interval timing, circadian timing and seasonal timing, respectively. Interval timing: response rate in mice trained to respond to a 17 s interval (data from authors’ laboratory). Circadian timing: skin temperature from a 20-year-old female subject (data from authors’ laboratory). Seasonal timing: plasma prolactin levels (ng ml−1) throughout the year (adapted from [8]). (Online version in colour.)

