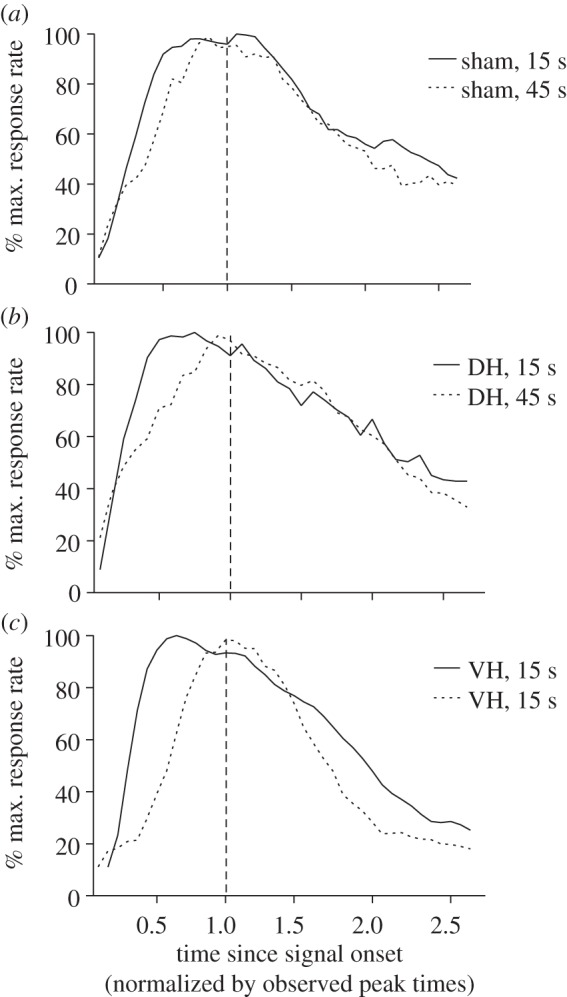
Figure 4.

Superimposition plots of 15 s and 45 s bi-peak functions obtained from post-operative bi-peak sessions 16–18 for sham, dorsal (DH) and ventral (VH) hippocampal pre-training cytotoxic lesion groups. The 45 s peak functions were first normalized to the same relative percentage scale of the 15 s functions, and then re-normalized by their observed peak times.
