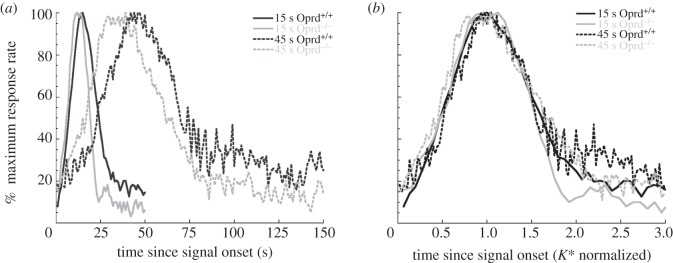
Figure 6.

Bi-peak functions plotted on absolute (a) and relative (b) timescales for the Oprd mice. The bi-peak functions for the wild-type mice (Oprd+/+) are depicted in black and the bi-peak functions for the knock-out mice (Oprd−/−) are depicted in grey. The 15 s peak functions are displayed using solid lines and the 45 s peak functions are displayed using dashed lines. In (a), response rates are plotted as a function of time since signal onset. Lever presses were pooled across all peak trials in a session and then normalized by the maximum response rate for each subject. Data were then averaged across three sessions for all the subjects in a treatment group and then re-normalized to the maximum response rate. In (b), the 45 s peak functions were first normalized to the same relative percentage scale of the 15 s peak functions, and then the placement of both the 15 s and 45 s functions were re-normalized by their obtained peak times to determine the K* values.
