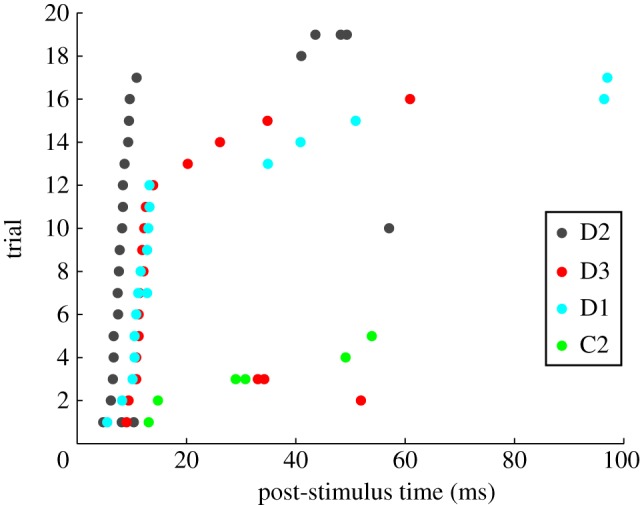
Figure 1.

Latency coding of stimulus location in rat somatosensory cortex. Raster plot of the spike times of one example neuron recorded from barrel-column D2 in rat somatosensory cortex in response to a sudden whisker deflection applied at time 0. Each dot represents the time of a spike, and each row represents a different stimulus presentation (trials ordered by increasing first-spike latency). Responses to deflection of different whiskers are plotted using different colours. X-axis represents post-stimulus time. Vibrissae C1-3, D1-3, E1-3 were stimulated in this dataset, but only trials in response to deflection of the four whiskers that elicited a significant response are shown. Figure prepared from data published in [6].
