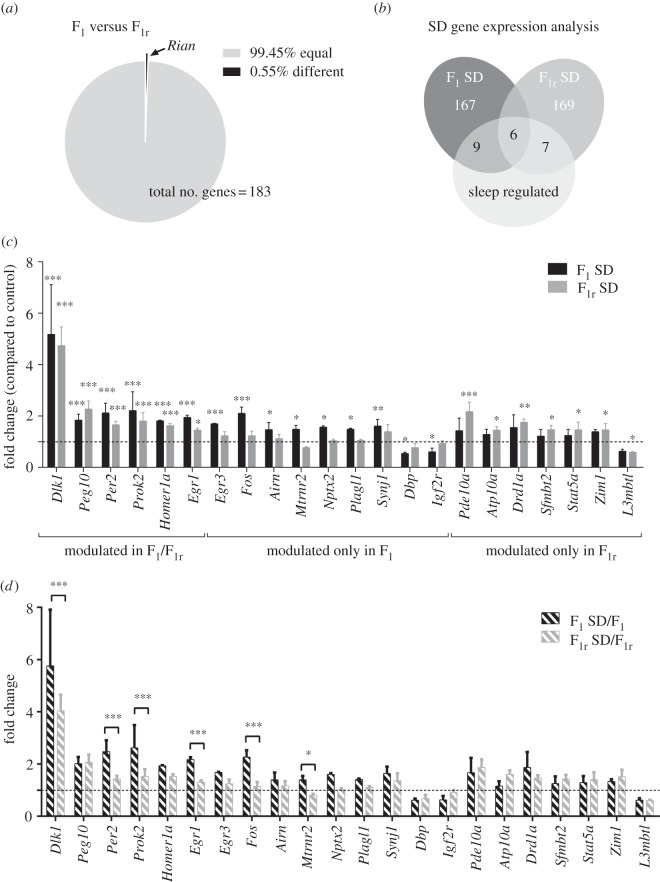
Figure 2.
Gene expression of 230 genes in F1 and F1r mice cohorts after sleep deprivation. (a) Representation of the statistical analysis of the gene expression of 183 detectable targets (Ct ≤ 30) among the F1 and F1r cohorts. (b) Visual classification of the gene expression profiles of F1 and F1r animals after SD. Sleep-regulated genes compose 8.2% and 7.1% of the total genes of the F1 and F1r groups, respectively. (c) Gene expression levels were quantified using Qiagen RT-PCR custom plates. Bars represent the mean + s.e.m. of three different samples for F1 SD and F1r SD mice. *p < 0.05; **p < 0.01; ***p < 0.001 by two-way ANOVA plus Bonferroni's post-test. (d) Parent-of-origin regulation of sleep-dependent genes among F1 SD/F1 and F1r SD/F1r. Bars represent the mean + s.e.m. of three different samples for F1 SD and F1r SD mice related to their control groups (F1 or F1r, respectively). *p < 0.05; **p < 0.01; ***p < 0.001 by two-way ANOVA plus Bonferroni's post-test.

