
Figure 3.
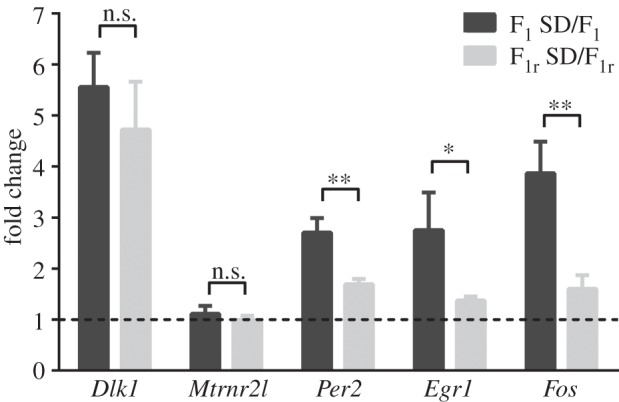
Parent-of-origin regulation of sleep-dependent gene expression. The genes shown were quantified by RT-PCR with the second set of primers (table 1). Bars represent the mean + s.e.m. of three different samples for F1 SD and F1r SD mice related to their control groups (F1 or F1r, respectively). *p < 0.05; **p < 0.01; ***p < 0.001 by Bonferroni's test. n.s., Non-significant.