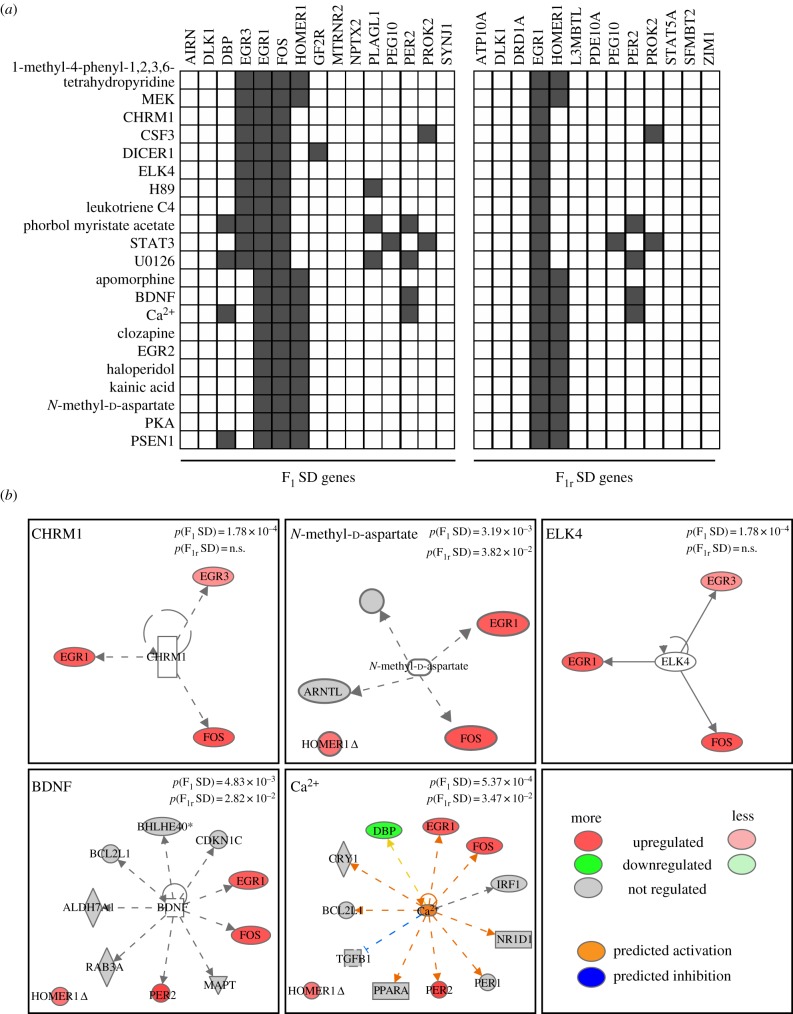
Figure 4.
The functional analysis and networks of F1 SD- and F1r SD-regulated genes. (a) A heat map shows the significantly enriched upstream mechanisms of regulation of F1 SD-regulated or F1r SD-regulated genes according to Ingenuity Pathway Analysis (see the electronic supplementary material, table S3 and figure S1 for the complete list). (b) A number of highly significant classes in F1 SD were further selected and shown as individual networks; p-values of overlap are also reported. (Online version in colour.)

