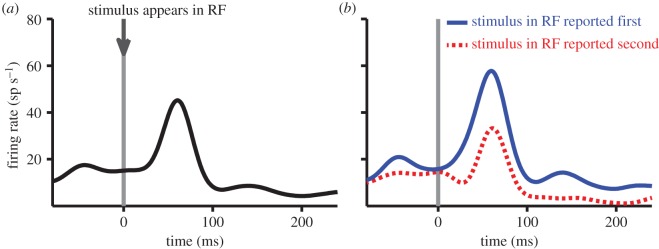
Figure 2.

Response of a single LIP neuron for SOA = 0 ms. (a) Shows spike-rate function aligned to the appearance of the stimulus in RF, for all trials. (b) Depicts the same data, but with the trials divided by whether the animal reported the stimulus in the RF appearing first (solid blue) or second (dotted red). Spike-rate functions for individual units were generated by convolving 1-ms-binned histograms with a Gaussian function (SD = 15 ms). (Online version in colour.)
