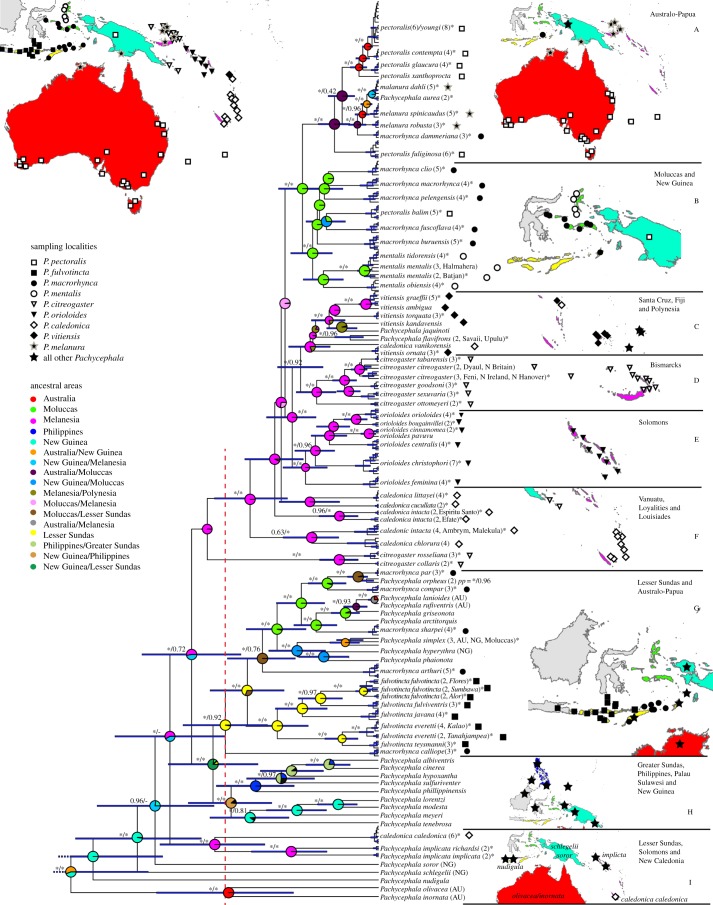
Figure 1.
Estimate of phylogenetic relationships, relative divergence times (BEAST) and ancestral area reconstructions (LAGRANGE) of Pachycephala. Members of P. pectoralis (sensu lato) are indicated by signs following the taxon name, based on the species groups suggested by Galbraith [49]. Support values are indicated to the left of internodes and after the taxon name, and represent posterior probabilities (PP) (asterisk (*) indicates PP = 1.00) from the analysis in BEAST of the concatenated dataset (two nuclear and two mitochondrial genes) and the mitochondrial dataset (ND2 and ND3). Support values are only indicated if at least one analysis provides a posterior probability of 0.95 or higher. The map in the upper left corner indicates sampling localities included in the study, with colours representing the regions according to the ancestral area analysis. Maps to the right of each major clade show sampling localities for all individuals in the group. Pie charts at internodes indicate the probability of the area of origin coloured according to the ‘ancestral areas’ legend. The red dotted vertical line denotes half-time between the origin of Pachycephala and the present.

