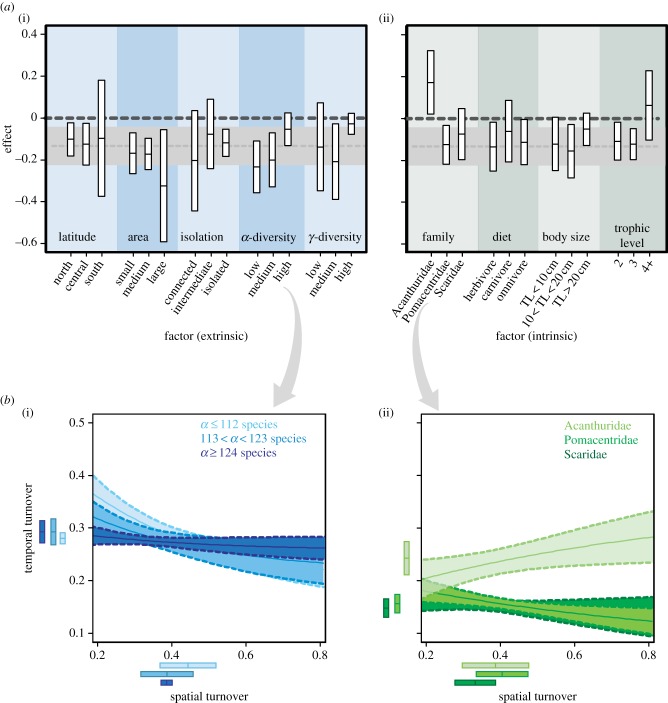
Figure 3.
(a) Mean and 95% CIs of the relationship between spatial and temporal turnover (Bray–Curtis) for different spatial and environmental factors and life-history traits. The sign of the effect is positive (or negative) for a positive (or negative) relationship, with the effect size expressed as the absolute value of the regression coefficient (see text for details). TL, total length (cm). For comparison, the light grey dotted line and envelope show the mean and 95% CI, respectively, for the global relationship, depicted in (i). (b) Relationship between spatial and temporal turnover (Bray–Curtis) among levels of increasing α-diversity (i) and for the three most abundant families (ii). Box plots to the left and below each panel plot indicate the means and standard deviations of spatial and temporal turnover indices for three levels of α-diversity and for three taxonomic families (see text for details). Other parameters are identical to figure 2.

