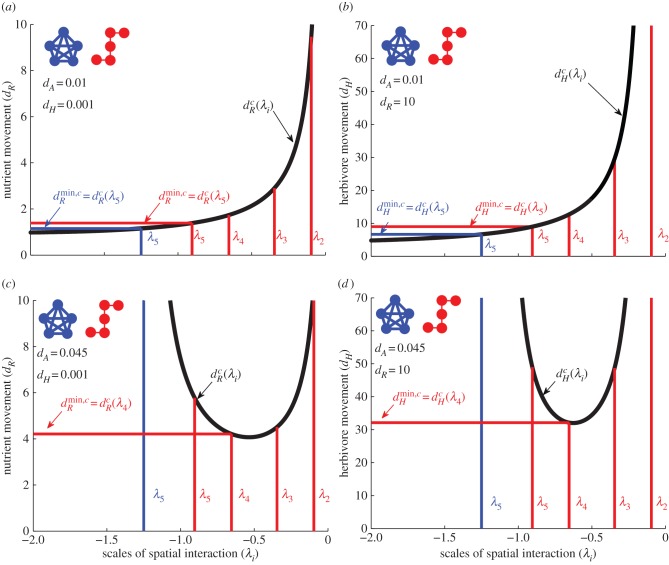
Figure 2.
Relationships between the scales of spatial interaction (λi) and the minimum critical movement rates of nutrients (dRmin,c) and of herbivores  for given meta-ecosystems (blue and red inset) as described by equations (3.1) and (3.2) at different autotroph movement rates (dA).
  is determined by evaluating
  (black line) at all the scales of spatial interaction the meta-ecosystem (blue and red vertical lines) and taking the smallest value of dR found (blue and red horizontal lines). The procedure is identical for
  . Note that for the blue meta-ecosystem, λ5 = λ4 = λ3 = λ2. (a,b) At low dA,
  and
and  are determined by λ5, the shortest scale of spatial interaction, for both meta-ecosystems. (c,d) At higher dA, there are no positive
  and
and  values for the blue meta-ecosystem owing to lack of longer scales of spatial interaction, while
  and
and  are determined by λ4, the second shortest scale of spatial interaction, for the red meta-ecosystem.

