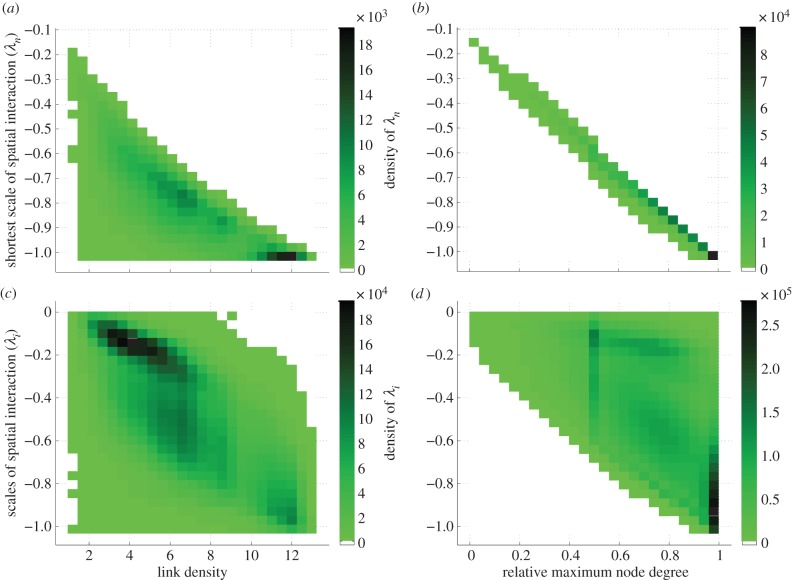
Figure 3.
Relationships between network connectivity measures and the scales of spatial interaction in randomly generated 30 × 30 connectivity matrices. (a) Higher link density is somewhat associated with more negative values for the shortest scale of spatial interaction (λn), though there is a good deal of variability. (b) Higher maximum node degree is tightly associated with more negative values for the shortest scale of spatial interaction (λn). (c) Higher link density is associated with more negative (i.e. shorter) scales of spatial interaction, but the ranges are very large at any given link density level. (d) Higher maximum node degree allows for more (shorter) negative scales of interaction, which matches with (b), but provides little insight on the location of the longer scales of spatial interaction for a given maximum node degree for a meta-ecosystem. (Online version in colour.)

