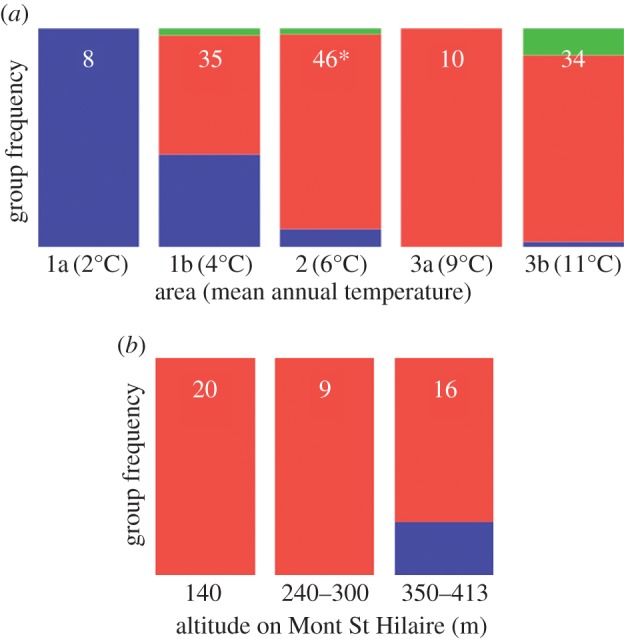
Figure 2.

Saccharomyces paradoxus groups are distributed along a north–south cline. (a) Frequency of three North American S. paradoxus genetic groups (A, green; B, red; C, blue) in five climatic areas (figure 1). The total number of strains in each area is indicated by white. All strains identified by Kuehne et al. [29] were also included in these calculations. The asterisk (*) indicates 45 strains of area 2 collected in Mont St Hilaire. (b) Frequency of genetic groups B and C at different altitudes on Mont St Hilaire. Group C is only found at higher than 350 m (see electronic supplementary material, table S2).
