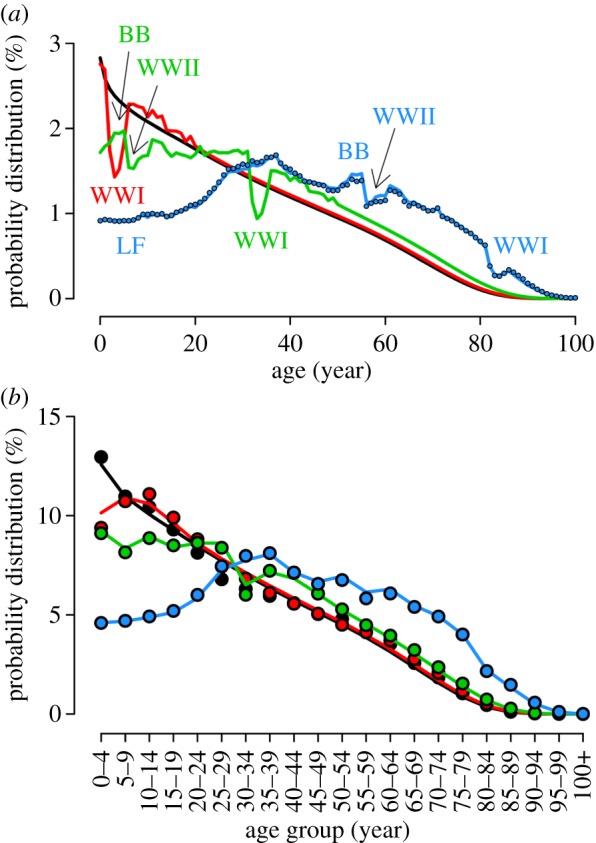
Figure 1.

(a) Simulated age distribution of the Italian population in 1901, (black line); 1921, (red line); 1951, (green line) and 2001, (blue line). Labels indicate the most important demographic events of the last century: the two World Wars (WWI and WWII, respectively), the ‘baby boom’ of the 1950s (BB) and a period of low fertility since the 1970s (LF). Blue points represent the actual age distribution as resulting from the 2001 census. (b) Simulated age distribution of 1901, 1921, 1951 and 2001 (lines) compared to historical records, available for 5-year age groups (points).
