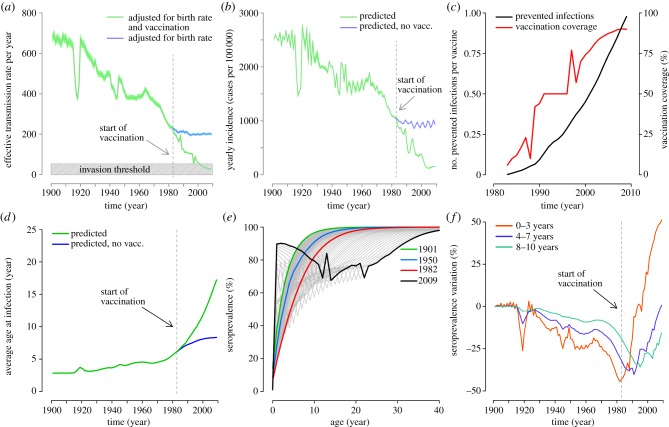
Figure 4.
(a) Effective transmission rate over time adjusted for birth rate and vaccination (mean: green line, 95% CI: light green area) and adjusted only for birth rate (mean: blue line, 95% CI: cyan area); see the electronic supplementary material for details. The vertical dashed grey line represents the year in which the Italian immunization programme started. The shaded grey area represents the invasion threshold of the disease. (b) Estimated yearly incidence over time (mean: green line, 95% CI: light green area) and estimated yearly incidence over time by assuming no vaccination (mean: blue line, 95% CI: cyan area). The vertical dashed grey line represents the year in which the Italian immunization programme started. (c) Number of avoided infections per vaccine dose (black, scale on the left) and vaccination coverage (red, scale on the right) over time. (d) Predicted average age at infection over time (green line) and predicted average age at infection by assuming no vaccination (blue line). The vertical dashed grey line represents the year in which the Italian immunization programme started. (e) Simulated average measles seroprevalence by age in 1901 (green), 1950 (blue), 1982 (i.e. the year before the start of measles immunization programme; red) and 2009 (black). Grey lines represent serological profiles in intermediate years. (f) Percentage variation of seroprevalence by age group over time with respect to the seroprevalence in 1901 in the same age group.

