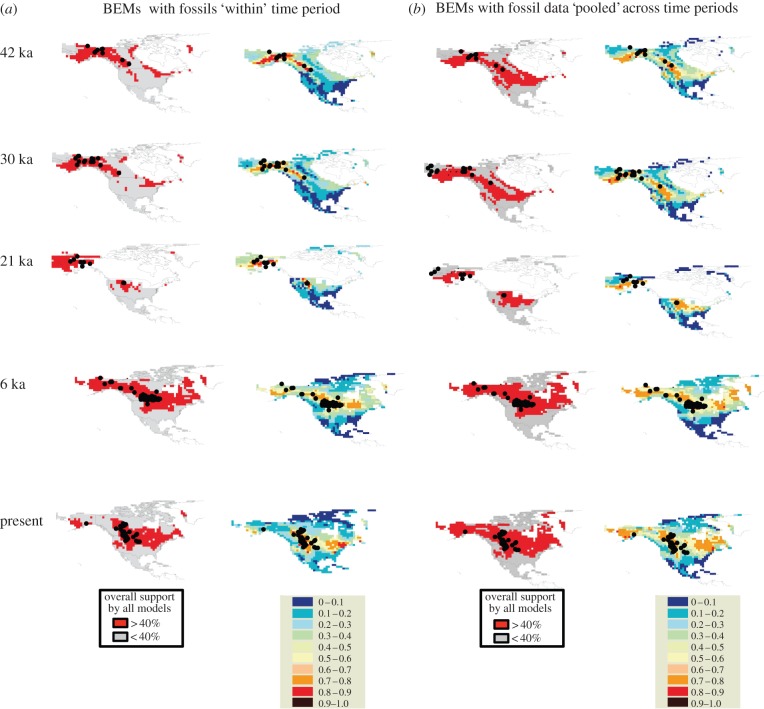
Figure 2.
BEMs predicting suitable habitat for B. bison over five time periods: 42, 30, 21, 6 and 0 ka. The areas for which over 40% of models resulted in suitable habitat are shown in dark shading on the left side of each panel and the overall probability of an area containing suitable bison habitat is shown on the right of each panel. (a) The ‘within period’ refers to climatic envelopes calibrated and projected within each period of time. (b) The ‘pooled period’ uses all the data for each period to create a summary environmental niche space that is projected to each time slice. Fossil localities are shown as black dots. (Online version in colour.)

