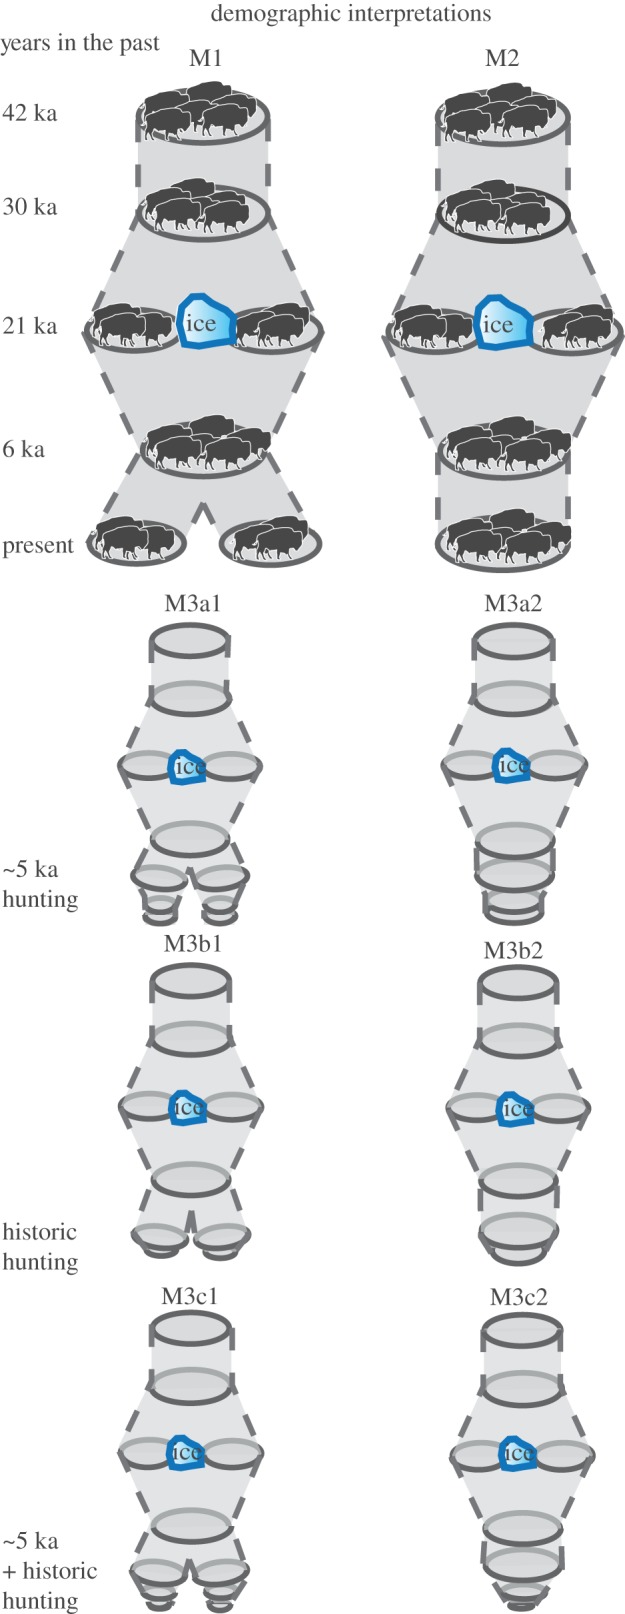
Figure 3.

Demographic models based on BEMs (M1 and M2) and a combination of BEMs and additional data (M3 variants). Each model illustrates the number of populations (number of discs) and relative size (width of disc) through time. Model 3 includes six variants that include large-scale bison hunting by Native Americans starting around 5 ka (M3a), large-scale bison hunting by European settlers (M3b) and a combination of both hunting events (M3c). Each hunting scenario is included in a model based on M1 (e.g. M3a1, M3b1 and M3c1) or M2 (e.g. M3a2, M3b2 and M3c2). (Online version in colour.)
