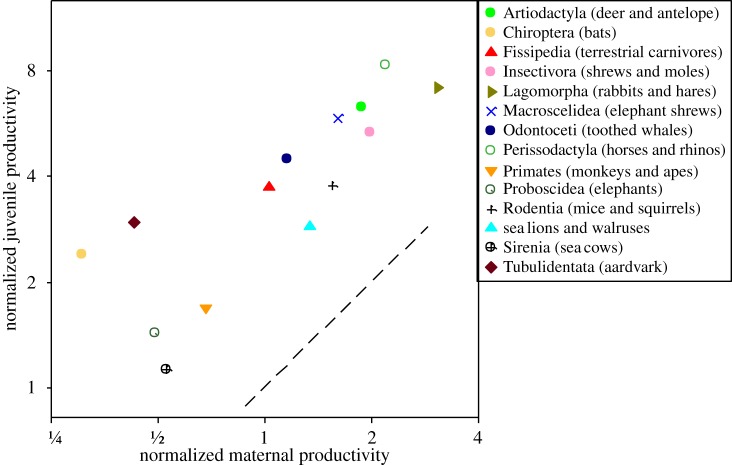
Figure 4.
Normalized juvenile productivity plotted against normalized maternal productivity for each of the lifestyle groups after allowing for body mass variation and phylogeny. Symbols as in figure 3b. Dashed line shows where juvenile and maternal productivities are equal.

