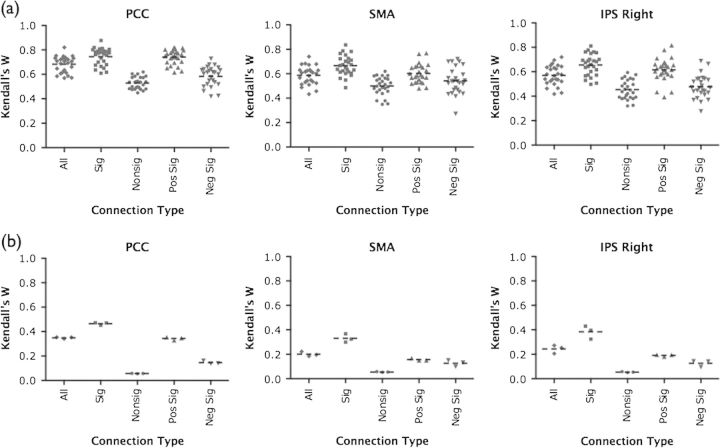
Figure 12.
Voxelwise analysis: factors effecting consistency. (a) Plots of within-subjects multiscan consistency (Kendall's W) of correlations (voxelwise regression parameter estimates) for each seed. Shown are box plots representing consistency of 1) all correlations, 2) significant correlations, 3) nonsignificant correlations, 4) significant positive correlations, and 5) significant negative correlations. Each data point represents an individual participant's multiscan Kendall's W. Dotted black lines represent the mean Kendall's W (i.e., averaged across 26 participants). (b) Plots of between-subjects multiscan consistency (Kendall's W) for correlations (voxelwise beta parameter estimates) from each seed set. Data points represent the between-subjects Kendall's W for each of the 3 scans and dotted black lines represent the mean Kendall's W (i.e., averaged across 3 scans).

