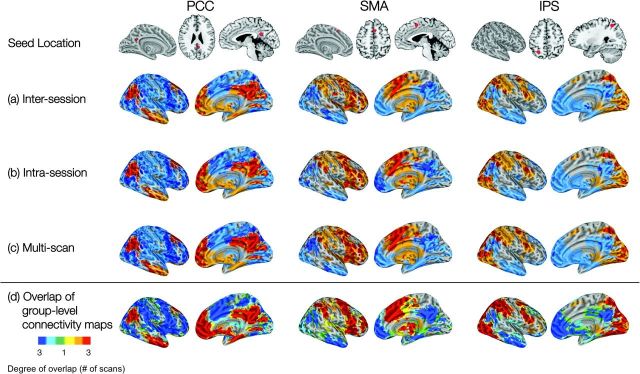
Figure 8.

Voxelwise analyses: maps (“networks”) of positive (orange) and negative (cyan) functional connectivity. For each seed ROI, voxels exhibiting an ICC > 0.5 are overlaid in red (positive correlations) and blue (negative correlations). (a) Intersession ICC overlaid on intersession group-level connectivity map; (b) Intrasession ICC overlaid on intrasession group-level connectivity map; and (c) multiscan ICC overlaid on multiscan group-level connectivity map. (d) Depicts the overlap among the 3 scans for the group-level connectivity maps: yellow/green signifies voxels significantly positively/negatively correlated in only one scan; orange/cyan signifies voxels significantly positively/negatively correlated in 2 scans; and red/blue signifies voxels significantly positively/negatively correlated in all 3 scans.
