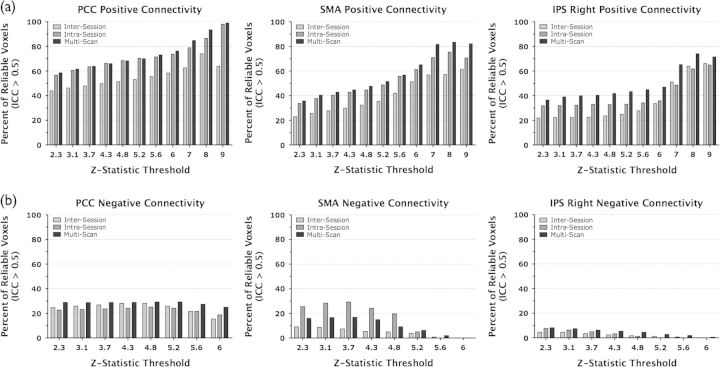
Figure 9.
Voxelwise analysis: comparison of reliability and increasing threshold values. (a) Bars represent the number of voxels that were significantly positively correlated with a seed region (Z > 2.3, i.e., suprathreshold voxels) and highly reliable (ICC > 0.5), expressed as a percentage of all suprathreshold voxels. Percent overlap is calculated for intersession, intrasession, and multiscan measures and for each seed region (PCC, SMA, and IPS right). At higher thresholds, a higher percentage of suprathreshold voxels are also highly reliable. (b) Bars represent the number of voxels that were significantly negatively correlated with a seed region (Z < −2.3) and highly reliable (ICC > 0.5). There is no effect of threshold on the proportion of reliable negative correlations.

