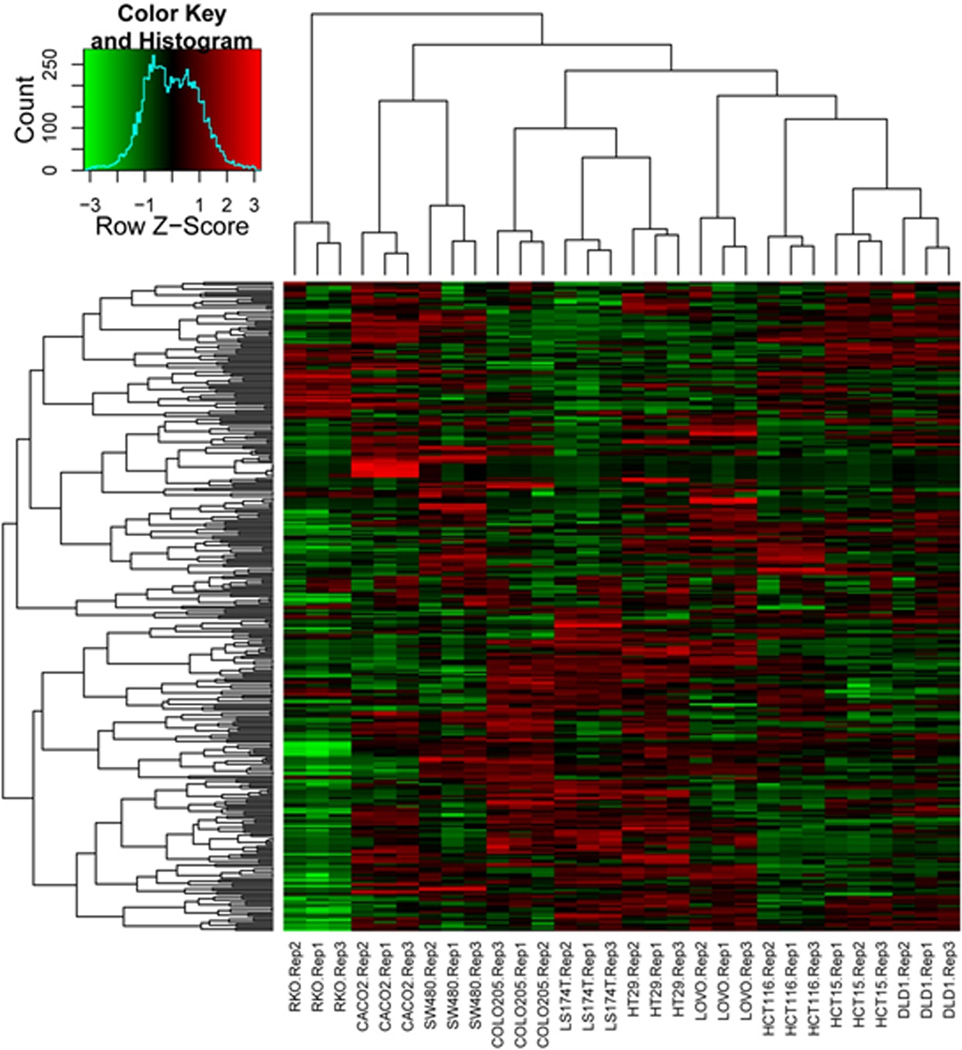
Figure 1.
Unsupervised heatmap of the top 300 most variable proteins across the 10 cell line dataset. Proteins were selected based on their variability between all cell lines. Spectral counts were log-transformed, normalized and used for clustering based on similarity in expression patterns. The three biological replicate preparations of cell lines clustered together in all cases, with the related cell lines DLD1 and HCT15 grouped closer together compared to the other cell lines (6 right-most lanes). RKO contains the most distinguishing features, mainly due to the absence of a large number of keratins expressed in the other cell lines.

