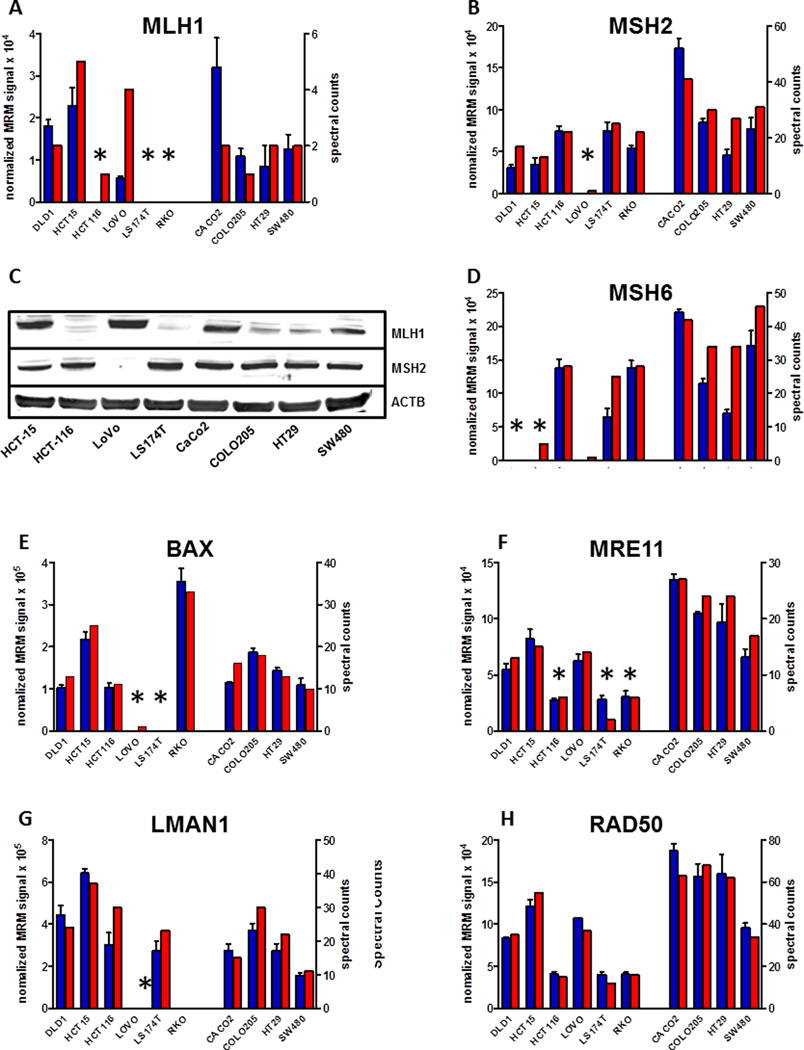
Figure 3.
Shotgun and MRM analyses provide consistent measurements of selective loss in expression of MMR proteins (MLH1, MSH2 and MSH6, panels A–D), selected protein products of MMR-sensitive target genes (BAX, MRE11, LMAN1, and RAD50, panels E–H). Shotgun proteomics data are plotted as spectral counts for triplicate analyses, whereas MRM data are plotted as summed signal intensity for measured transitions normalized to summed intensity for transitions measured for a reference peptide. Symbols above each bar indicate genotype for the corresponding gene, as summarized in Table S1 and in the cited literature. Panel C shows protein blot-analysis for MLH1 and MSH2 confirming protein levels observed by mass-spectrometry.

