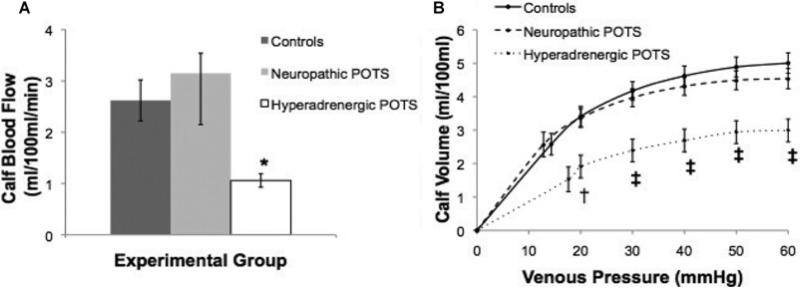
Figure 1. Supine Q̇calf (A) and Cv (B) between the groups.
(A) Hyperadrenergic POTS had significantly less Q̇calf than control subjects and neuropathic POTS subjects. (B) The volume–pressure capacitance curve was blunted in hyperadrenergic compared with controls and neuropathic POTS. Values are means ± S.E.M. *P < 0.05, †P < 0.01 and ‡P < 0.001 between the groups.

