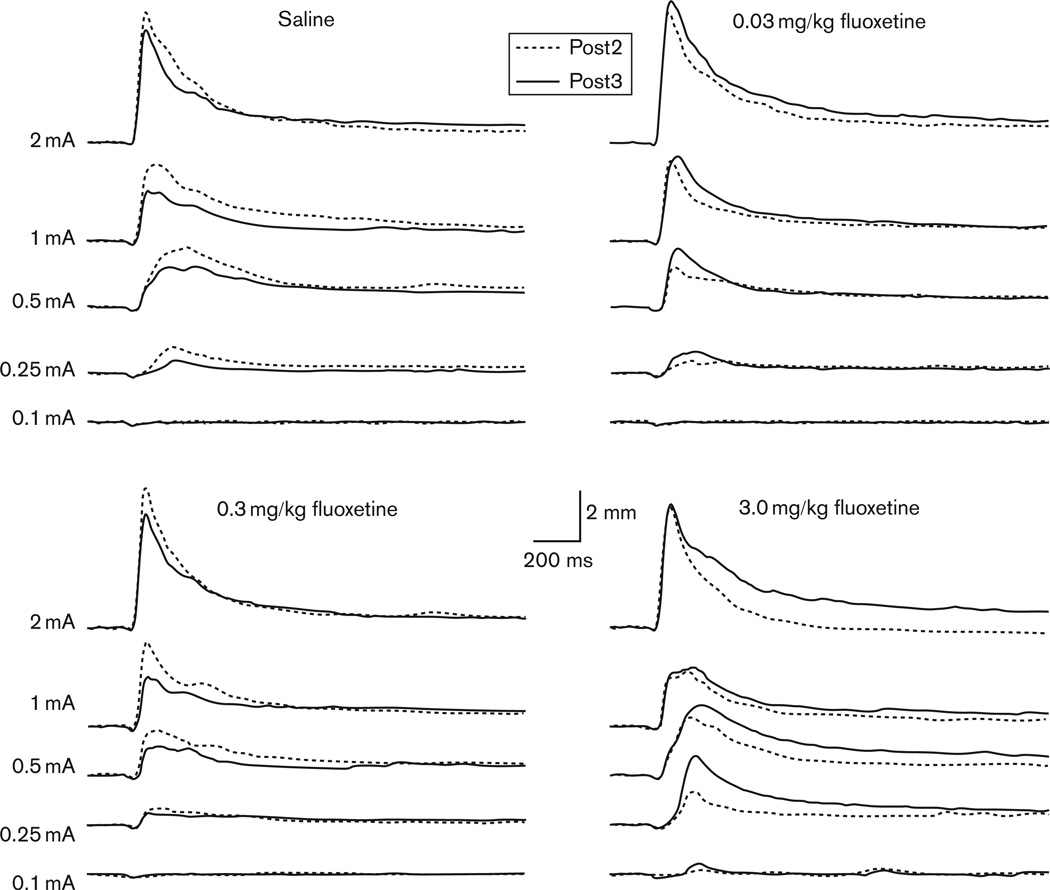
Fig. 3.
Average response topographies for the unconditioned response to the first 20 trials of the post-test (Post2, dotted black line) following drug treatment with 5 days of saline or fluoxetine (0.03, 0.3, 3.0 mg/kg) and then the post-test 1 week later (Post3, solid black line). Topographies are shown at the five unconditioned stimulus intensities (2.0, 1.0, 0.5, 0.25, 0.1 mA).

