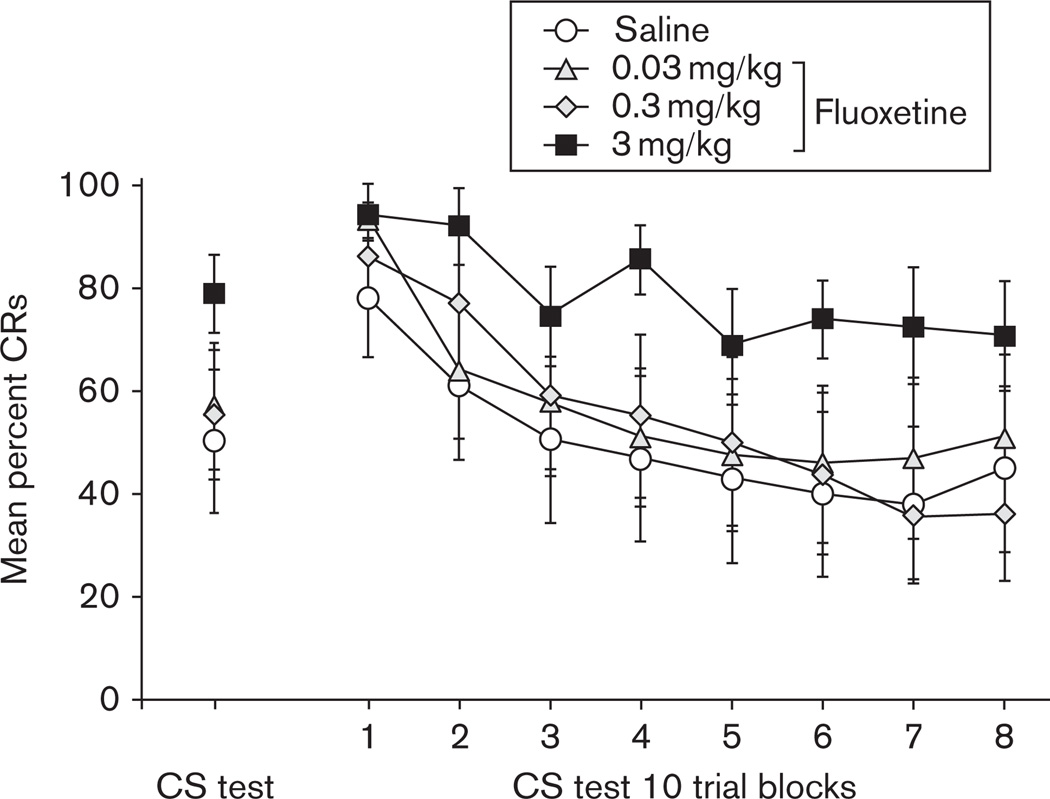
Fig. 6.
The mean percentage (±SEM) of conditioned responses (CRs) to the tone conditioned stimulus (CS) during a session of 80 CS-alone presentations (CS test, left side of graph), following cessation of saline (white circle) or fluoxetine treatment at a dose of 0.03 mg/kg (gray triangle), 0.3 mg/kg (bold gray diamond), or 3.0 mg/kg (black square). The right side of the graph (CS test 10 trial blocks) shows the breakdown of the 80 trial session into eight blocks of 10 trials each.

