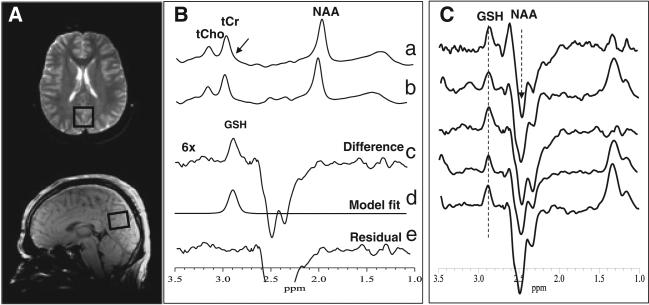
Figure 3.
(A) Location of a 2.0 × 3.0 × 3.0-cm3 occipital lobe voxel in which glutathione (GSH) was measured. (B) Demonstration of in vivo human brain GSH detection by 1H MRS: spectra a and b, single-voxel subspectra acquired in 15 min with the editing pulse on and off and 290 (580 total) interleaved averages; spectrum c, difference between spectra a and b showing the edited brain GSH resonance; spectrum d, model fitting of spectrum c to obtain the GSH peak area; spectrum e, residual of the difference between spectra c and d. (C) Stacked plots of edited spectra obtained as in (B) from five randomly selected subjects showing clear and consistent detection of GSH. NAA, N-acetylaspartate; tCho, total choline; tCr, total creatine.

