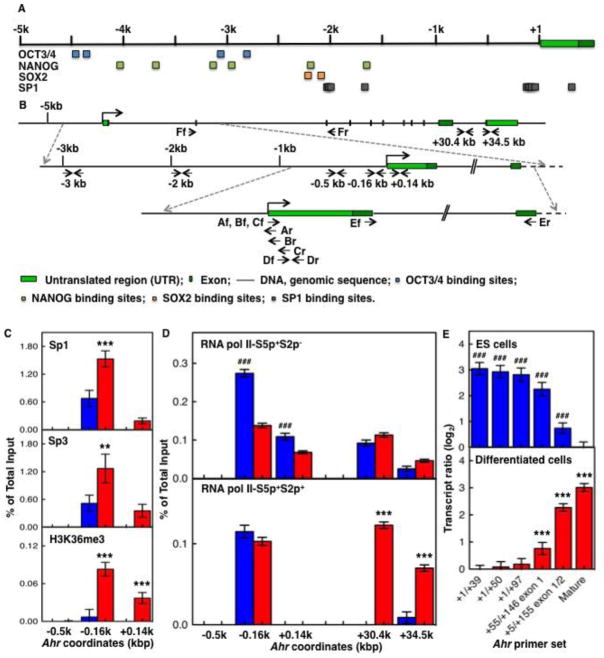
Fig. 2. Sp-factors and RNAPII control the transition of silent to activated Ahr.
(A) Schematic representation of the mouse Ahr gene and location of core pluripotency factors OCT3/4, SOX2, and NANOG and Sp1 binding sites along 5 kb of the Ahr promoter. MatInspector software from Genomatrix was used to screen binding sites of transcription factors. Blue, green, amber, and gray squares represent OCT3/4, SOX2, NANOG, and Sp1 binding sites respectively. (B) Location of primers used in this study. Upper level: structure of the Ahr gene from 5 kb upstream of the TSS to the TES region. Middle level: expansion of the sequence from 3 kb upstream of the TSS to the 2nd exon region. Lower level: expansion of the sequence from 1 kb upstream of the TSS to the 2nd exon. Arrows indicate primers and target DNA strands, forward (f)/reverse (r) versus sense/antisense. (C) ES cells (blue bars) and cells differentiated for 9 days (red bars) were compared for binding of Sp-factors (upper and middle panels) and active transcription histone mark H3K36me3 (lower panel) on the Ahr proximal promoter region. (D) binding of RNAPII-S5p+S2p− (upper panel) and RNAPII-S5p+S2p+ (lower panel) on both the Ahr proximal promoter and the TES region. The asterisk (*) and the pound (#) denote significant difference to ES or to day-9 differentiation, respectively: (*,#) p<0.05; (**,##) p<0.001; (***,###) p<0.001. (E) The ratio of Ahr short transcripts to mature mRNA was determined as described in the text; the upper panel shows the ratio of transcripts of various lengths in ES cells relative to mature mRNA in day-9 samples; the bottom panel shows the ratio of transcripts of various lengths in day-9 samples relative to mature mRNA in ES cells.

