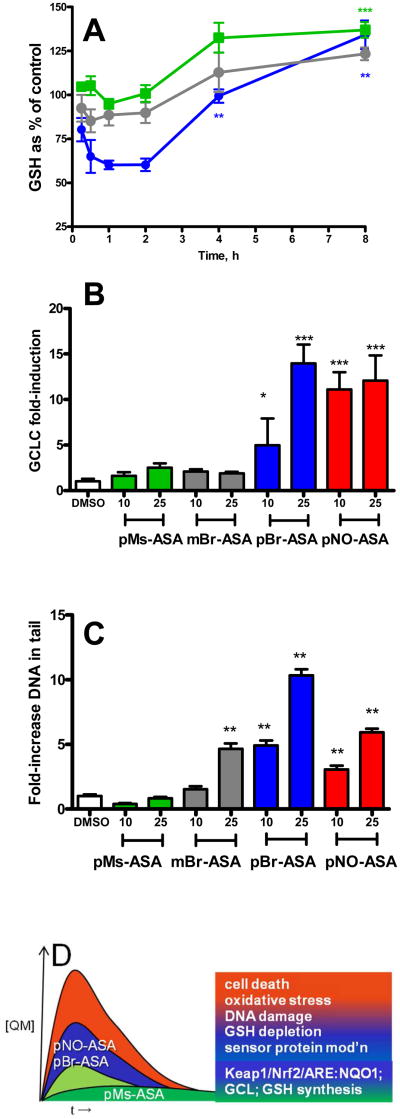
Figure 2.
Effect of NO-ASA and X-ASA analogues on intracellular GSH concentrations and DNA damage in HepG2 and Hepa 1c1c7 cells, respectively. (A) Total intracellular GSH concentrations measured after treatment of HepG2 cells with mBr-ASA (25 μM circle; orange), pBr-ASA (25 μM circle; green), or pMs-ASA (25 μM square; blue), data show mean and s.e.m. analyzed by one way ANOVA with Tukey's post test relative to data at the first time point (*** P < 0.001; ** P < 0.01); (B) Expression of GCLC mRNA in HepG2 cells after 4 h treatment with pMs-ASA, mBr-ASA, pBr-ASA, and pNO-ASA (10-25 μM). Data show mean and s.e.m. analyzed by one way ANOVA with Tukey's post test (*** P < 0.001) with respect to the DMSO-treated controls. (C) Single strand DNA damage, measured by Comet assay in Hepa 1c1c7 cells, after one hour incubation with pNO-ASA, mBr-ASA, pBr-ASA, and pMs-ASA (10 μM, 25 μM). Data show mean and s.e.m: significant differences with DMSO vehicle control were analyzed (** P < 0.01) by ANOVA with Tukey's post test. (D) Figurative representation of the relationship between flux of QM from bioactivation and biological consequences.

