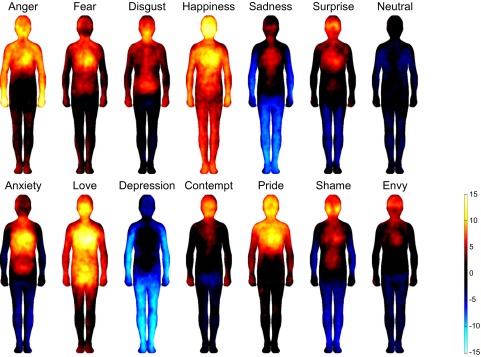
Fig. 2.

Bodily topography of basic (Upper) and nonbasic (Lower) emotions associated with words. The body maps show regions whose activation increased (warm colors) or decreased (cool colors) when feeling each emotion. (P < 0.05 FDR corrected; t > 1.94). The colorbar indicates the t-statistic range.
