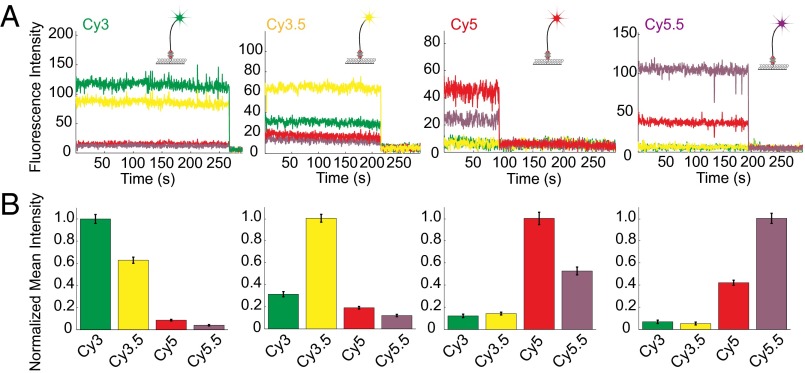
Fig. 2.
Fluorophore characterizations on the custom RS. (A) Example traces of Cy3- (green), Cy3.5- (yellow), Cy5- (red), and Cy5.5-labeled (purple) biotinylated oligonucleotides immobilized on the bottom of the ZMWs under dual laser illumination (532 and 642 nm), showing the percentage of bleedthrough. (B) Normalized mean intensities of the four spectral channels for each colored dye. Spectral bleedthrough to the neighboring channel is ∼50%, whereas bleedthrough to the farther channels is negligible. The low bleedthrough allows efficient separation of the four spectral fluorophores. Numbers of molecules analyzed (from left to right) are n = 301, n = 265, n = 280, n = 200. Only a portion (∼5%, randomly picked) of the entire SMRT Cell was analyzed because of the large amount of data generated. Error bars are SEMs.

