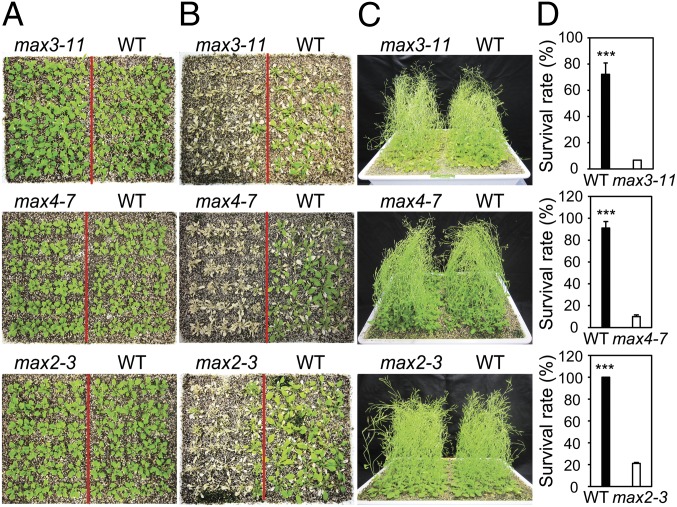
Fig. 1.
Hypersensitivity of SL-deficient and SL-signaling max mutant plants to drought stress. (A) Three-wk-old WT and SL-deficient max3-11 and max4-7 and SL-signaling max2-3 mutant plants before being subjected to a drought stress. (B) WT and mutant plants subjected to a drought stress and then rewatered for 3 d. Inflorescences were removed from the surviving plants before photographing. (C) Unstressed (control) WT and max plants grown in parallel with the drought test. (D) Percent survival rates of WT and mutant plants. Data represent the mean and SE from data pooled from three independent experiments (n = 30 per genotype per experiment). Asterisks indicate significant differences as determined by a Student t test (***P < 0.001).

