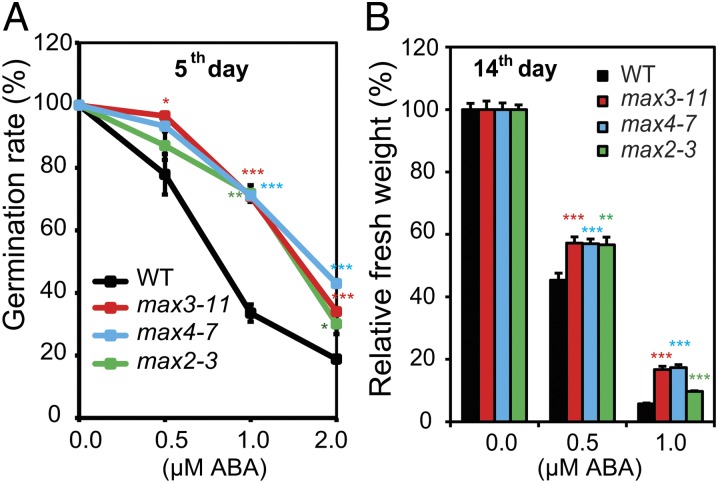
Fig. 3.
Response of SL-deficient and SL-signaling max mutant plants to exogenous ABA treatment. (A) Percent germination of SL-deficient max3-11 and max4-7 mutant, SL-signaling max2-3 mutant, and WT seeds treated with different levels of exogenous ABA. Data represent the mean plus SE of data pooled from three independent experiments (n = 50 seeds per genotype per experiment). (B) Relative fresh weight of SL-deficient max3-11 and max4-7 mutant, SL-signaling max2-3 mutant, and WT seedlings to application of different concentrations of exogenous ABA. Relative fresh weights of all seedlings were determined after 14 d of incubation at 22 °C. Data represent the mean and SE (n = 6, where each replicate is composed of seven pooled plants). Asterisks indicate significant differences as determined by a Student t test (*P < 0.05, **P < 0.01, and ***P < 0.001).

