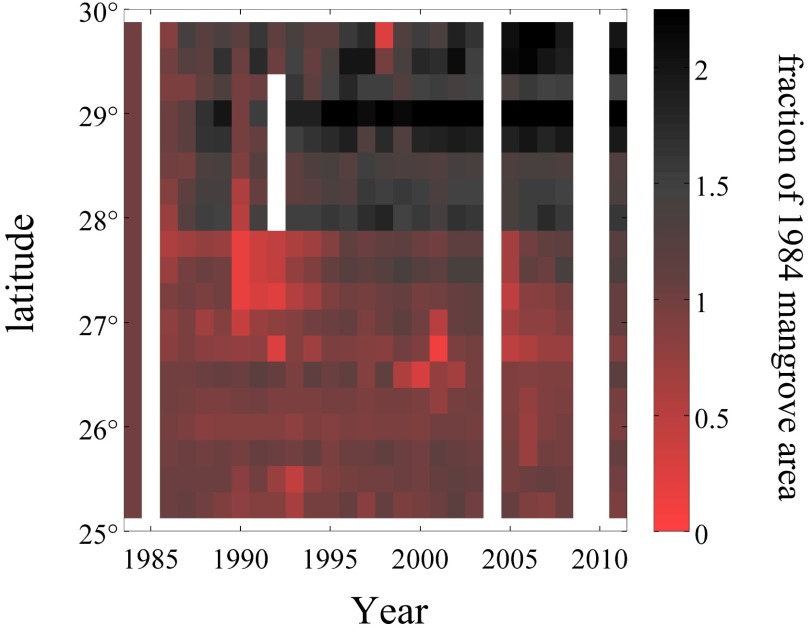
Fig. 2.
A 28-y time series of mangrove area separated into 0.25° latitudinal bands. Mangrove area is displayed relative to the first year in the time series (1984). (Right) A value of 1 indicates no change (100% of 1984 area), 0 indicates total loss of mangroves, and 2 indicates a doubling of mangrove area. Data were calculated from Landsat imagery collected each year between April and July. White areas indicate that no cloud-free Landsat data were available.

