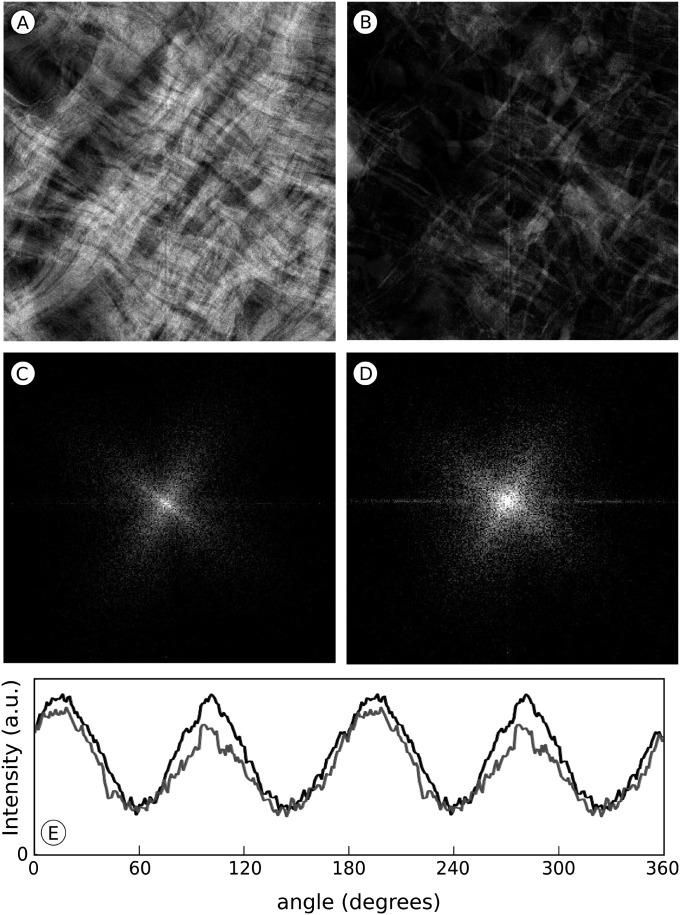
Fig. 3.
Analysis of collagen bundle and cellular filopodia directionality in the cornea of a 12-d chicken embryo. A representative volume measuring ∼4.74 × 4.84 × 0.33 μm3, obtained by SBF SEM in which either the collagen bundles or the filopodia are displayed, is projected down its z axis (perpendicular to the corneal surface). (A) 2D projection of the volume showing collagen. (B) As A but of the volume showing filopodia; in A and B protein density is represented in lighter tones. (C) Fourier transform of A. (D) Fourier transform of B. (E) Sum of the radial integrated profiles of the transforms from the projections of the collagen bundles (gray) and the filopodia (black) from 16 randomly selected volumes. Peaks arise from the cross-shaped patterns in the transforms; they are ∼90° apart and occupy the same positions in both graphs indicating that collagen fibrils and filopodia run parallel to each other, both sets along two mutually orthogonal directions.

