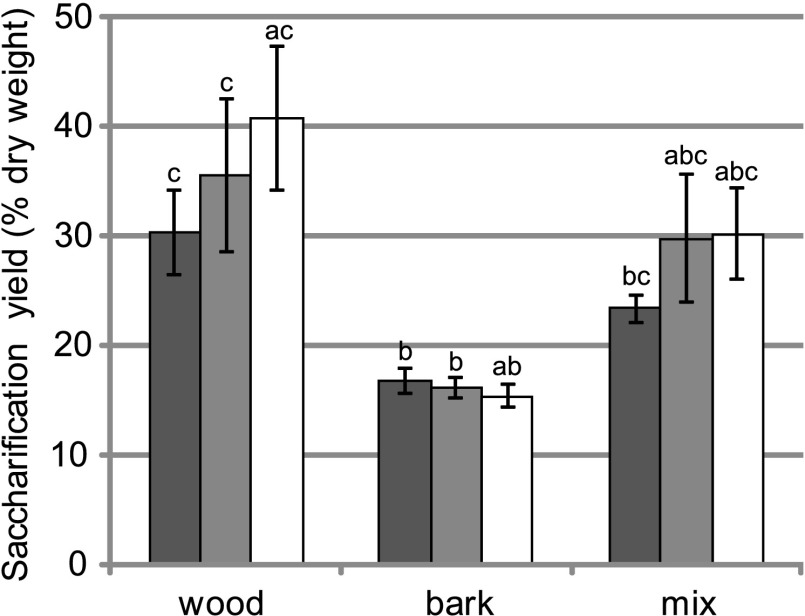
Fig. 4.
Saccharification yields of wood and bark analyzed separately and of wood–bark mixtures of transgenic trees and WT of the Belgian field trial. The same trees that were selected for SSF and wood compositional analysis were used (WT, n = 6; FS3, n = 6; FS40, n = 7). A pretreatment with 6.25 mM NaOH was applied. Error bars represent SDs. Dark gray, WT; light gray, FS3; white, FS40. aSignificantly different compared with WT within the same tissue; bsignificantly different compared with wood within the same line; csignificantly different compared with bark within the same line.

