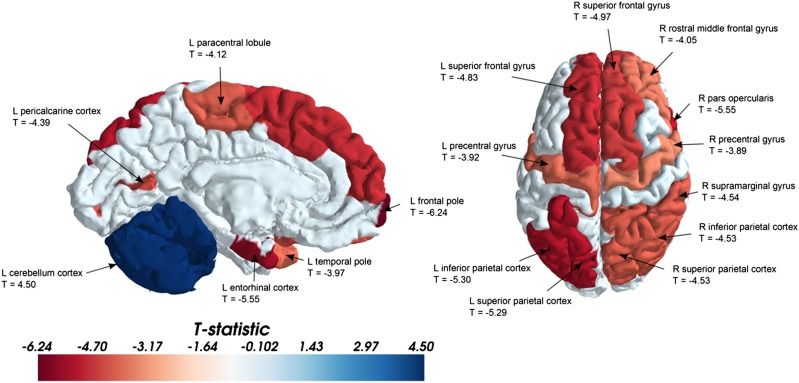
Fig. 3.
Representative regions of the brain that have a higher PC at a significance level of P < 0.001. The regions have been projected onto the surface of the brain for better visualization. Red indicates a higher PC in the females, and blue indicates a higher PC in males (mainly localized to the cerebellum). Representative regions and their corresponding T values are shown in the figures. The other regions that show significant differences (with their respective T values; negative values indicate females > males) are listed in Table 3. These tests revealed that although multiple regions have higher PCs in females, the cerebellum has a higher PC in males. L, left; R, right.

